Hints from Life to AI, edited by Ugur
HALICI, METU, 1994
artificial versus natural stereo depth perception
Ugur M. Leloglu
TUBITAK-AEAGE, METU
06531, Ankara, TURKEY
lel@tbtk.metu.edu.tr
Some cues on stereo vision that are implied by research
on natural visual systems are overwieved and then the methods used by computer
vision systems for solving the same problem is overviewed. The effect of those natural cues on computational stereo
is discussed.
1. Introduction
Visual
perception is an interpretation of 2-dimensional time-varying light information
on the retinae to form a spatiotemporal reconstruction of 3-dimensional world.
During the long course of evolution, this ability has reached an astonishing
complexity, especially, in higher animals. From the "meaningless"
sensory input, that is, from a set of activation values of sensory cells, a
rich, abstract description of the environment is derived. The recovery of the
third dimension information that is lost during the projection on the retinae
is vital in this reconstruction process. In human stereo vision system, there
are several known ways of estimating the depth like motion, shading, texture
and stereo. Although these mechanisms are known in principle, the underlying
biological structure and processes are not totally solved yet. Stereo vision is
one of the most investigated depth perception mechanisms.
Figure 1:
Eyes are fixated on the farthest of three ballons.
The
stereo vision is based on the differences between the right and left eye
images. Due to the distance between the eyes (interocular distance), the
projections of a certain point on the two retinae are at different positions.
The difference in these positions is called disparity and its value is related
to the distance of the object. In Figure 1 and Figure 2 this process is
illustrated schematically. The two eyes are fixated on the farthest of three
ballons (Figure 1). That is, the eyes are directed such a way that the images
of that ballon are at the centers of both retinae. The resulting left and right
images are shown in Figure 2. It is clearly seen that the disparity values are
larger for closer ballons. Once, for each point in one of the image, the
corresponding point in the other one is determined, the depth of all points can
be calculated as a function of the eye vergence.
Figure 2:
The images formed on left and right retinae of eyes in Figure 1.
Our
brains do this computation for us continuously and we do not even notice this effort:
it is totally unconscious and automatic. To understand how this is possible is
subject of several disciplines. Neuroanatomy and neurohistology identify the
structures involved in vision in macro and micro scale, respectively.
Neurophysiology tries to explain how these structures function. Psychophysics
examine how certain visual inputs are perceived under certain conditions.
Cognitive
psychology tries to explain the stereo mechanism in a more abstract level than
neurophysiology.
Besides
other reasons, to understand natural stereo vision is useful in constructing
similar artificial systems. Such systems have a wide range of application areas
(though not all are innocent), so considerable effort is devoted to this area.
Any artificial system does not necessarily carry the properties of natural
systems as long as it works properly, but the ideas from nature always prove to
be powerful.
2. Problems in Matching
To
understand why calculating stereo correspondence is not a trivial task,
consider a stereo image pair given in
Figure 3 and the light intensity levels of two small image patches from this
figure (areas inside the rectangles in Figure 3) as given in Figure 4.
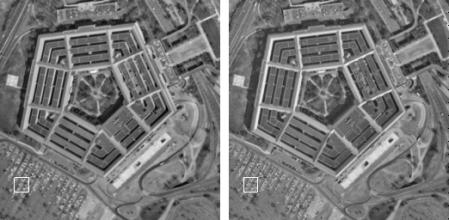
Figure 3: Pentagon
stereo pair (from Prof. Takeo Kanade of Carnegie-Mellon University)
The
average disparity of 1 pixel is not evident even after a long inspection by
eye. The light intensity is coded as binary numbers in computers and coded as
frequency of action potentials in human retina, but the very same data is the
input of both systems. A simple comparison of intensity values is clearly not
sufficient for determining corresponding points. One of the reasons for
differences in intensity values is the noise that appears in any sensor either
biologic or electronic. Another reason is reflectance properties of most
surfaces: the light reflected from the surface depends on the viewing angle.
Areas with no significant texture and areas with repetitive texture like a
chess table increases the ambiguity. The areas which are seen in one image but
occluded in the other are another source of ambiguity because we do not know
which areas are occluded before calculating correspondence.
Since
intensity values change considerably across images, we need some invariant
properties for matching. These matching primitives may be edge points, line
segments blobs or similar local image properties which can be calculated by
simple local processing units. Alternatively, the matching of images can be
postponed until monocular recognition of objects in the images. Then recognised
objects can be matched easily. After reviewing some facts on natural stereo
vision, we will discuss which strategy is used by biological systems and which
one is appropriate for computer stereo vision.
|
129
124 132 135
123 130 131
127 127 120
112 123 111
126 147 129 149
142 149 157
142 134 128
128 137 129
125 114 124
136 132 128 169
177 156 159
161 136 126
129 155 158
145 141 166
154 131 129 157
162 156 160
140 129 127
127 133 147
157 172 166
139 131 132 159
147 132 144
131 129 126
135 163 156
159 170 147
131 136 140 146
150 138 133
127 130 125
124 142 143
149 151 129
127 133 152 119
139 139 128
126 123 125
131 131 124
131 129 111
114 118 134 103
113 128 126
126 126 130
149 151 152
143 112 96
105 113 133 108
124 127 125
124 145 157
146 152 168
149 122 117
120 129 152 127
128 124 121
111 129 165
155 149 151
137 130 138
149 143 143 132
126 124 120
110 120 144
167 159 136
130 126 118
144 158 144 128
125 121 107
116 124 123
144 155 134
130 123 104
127 148 148 125
123 115 108
128 140 145
143 133 131
134 147 138
142 143 163 124
122 105 119
151 167 175
150 131 130
137 165 175
163 145 161 126
128 124 135
159 163 161
136 129 127
132 166 173
149 143 141 131
133 137 148
153 162 145
131 128 121
126 149 149
134 133 149 a) Intensity levels of left patch 139 160 139 125
134 136 134
133 120 128
113 113 137
144 132 125 148
150 155 150
136 135 133
148 147 146
122 144 154
138 136 130 178
154 160 155
136 135 126
145 163 147
152 177 159
140 136 133 154
151 159 139
137 132 126
140 152 159
173 162 142
142 137 137 147
134 146 136
135 129 135
167 156 155
165 143 139
139 144 154 152
142 135 134
129 128 133
145 133 151
154 134 135
136 152 172 140
141 134 133
125 140 155
139 131 138
133 124 119
113 130 162 133
134 132 130
125 135 162
160 156 145
129 118 114
115 130 141 134
132 131 123
150 168 150
160 167 149
137 132 137
132 151 145 133
132 128 115
138 170 154
158 144 137
138 141 161
153 140 134 134
131 126 121
135 144 159
163 139 140
130 113 143
162 142 129 132 125
116 126 132
131 138 146
139 139 128
122 139 148
151 154 128
118 126 143
155 155 152
138 138 138
154 159 159
147 163 170 128
112 129 153
159 161 144
138 136 133
162 181 161
146 146 173 131
132 143 151
157 149 138
137 129 137
166 166 146
148 140 149 137
133 141 127
151 140 137
135 129 140
160 150 140
150 168 144 b) Intensity levels of right patch |
Figure 4:
Intensity levels of two patches shown in Figure 3.
3. Natural Stereo Vision
Although
a complete theory of biological stereo vision is not built yet, there is a
large body of information obtained through neurophysiological and psychological
research on steropsis. Here, some facts on human stereo vision which are
closely related to computer stereo vision will be briefly presented. Interested
reader is recommended to refer [Hubel88], [Bruce90] and [Splillmann90] for
detailed information.
The speed of human stereopsis
A
very remarkable feature of human stereopsis is its speed: it takes about 200
msecs from presentation of the stimulus to the occurrence of depth perception [Yeshurun89].
That duration is very close to the time needed for the information on the
retinae to reach to the visual cortex via the visual pathway.
Stereopsis is a Low-Level Process
Stereopsis
is a low level process; that is, it does not require recognition or any
abstract understanding of the image. It was first demonstrated by Julesz that
[Julesz60] stereopsis survives in the absence of any monocular cue such as
texture, a priori knowledge on the shapes and sizes of objects, shading, etc.
Figure 5 is an example of random dot stereograms which was invented by Julesz.
One can see the floating square above the background when he fixates his eyes
at a nearer point in such a way that the two images overlap in the centre. But
this phenomenon does not imply that other depth cues do not effect the stereo
process. On the contrary, there is strong evidence that presence of monocular
depth cues facilitates stereo vision.
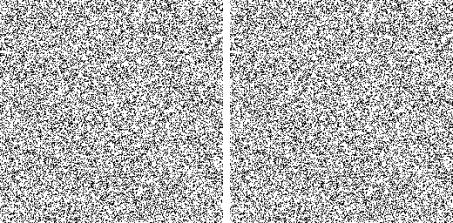
Figure 5:
A random-dot stereogram
Limited Fusional Area
Only
the surfaces within a specific disparity interval, so-called Panum's fusional
area, can be fused. The extent of this range is measured between 10-40 minutes
of arc depending on the data used. There is evidence that this range is larger
for inputs with low frequency content compared to high frequency inputs
[Marr82] [Schor84].
Effect of Contrast
It
was shown by Julesz that [Julesz71] changes in the magnitude of the contrast
across the images does not destroy stereopsis, but a change in the sign of
contrast makes fusion of images impossible [Julesz60].
Hyperacuity
Even
though the average distance among the light-sensitive cells of the retina
(cones), is about 20-30 seconds of arc at the fovea where those cells are
densest, the disparity differences down to 2 seconds of arc are detectable by
the human visual system [Morgan82]. But this hyperacuity drops drastically for
non-zero disparities [Badcock85].
Gradient Limit
If
the rate of change in disparity, that is, the disparity gradient, exceeds a
certain limit the images cannot be fused and objects appear as double
(diplopia) [Burt80].
Binocular Cells in Visual Cortex
Although
there is some interaction of information from both eyes on the way from retinae
to cortex, the first place where cells differentially sensitive to binocular disparity
are observed is the visual cortex in cats and monkeys. A considerable
proportion of the cells at visual cortex are binocularly sensitive [Hubel62].
Ocular Dominance
Binocularly
sensitive cells can be classified as balanced or unbalanced according to the
type of their sensitivity [Poggio77]. Balanced cells respond equally to stimuli
from each eye, but respond very strongly when stimulated binocularly.
Unbalanced cells either respond stronger to one eye or exhibit a complex ocular
dominance pattern.
A
certain layer of the visual cortex (layer 4) is organised in ocular dominance
columns. These vertical strips which are 1 mm thick in monkeys and 2 mm thick
in humans respond alternatingly to left eye and right eye. Binocular cells are
located above and below these monocular cells.
Orientation Selectivity
Almost
all of the cells in visual cortex exhibit orientation selectivity at various
angles. But most of them respond best to bars oriented within 20
degrees from the vertical [Poggio77].
Frequency Selectivity
Another
important property of these cells is their frequency selectivity. The range of
optimal spatial frequencies range from 0.3 to 3 cycles/degree in cats and 2 to
8 cycles/degrees in monkeys [Bruce90]. The bandwidth of cells in the average is
a little bit larger than one octave. The constancy of relative bandwidths over
scales can be justified by the statistics of natural images [Field87]. There is
almost constant energy in all channels, because the amplitude spectrum of
natural images generally fall off with 1/f.
Receptive Fields Types
Receptive
field is the activation pattern of a cell as a function of stimulus position on
the retina. According to the pattern of their receptive fields the cells in the
visual cortex are classified as simple and complex cells [Schiller76a] . Simple
cells have smaller receptive fields and low spontaneous activity. Some parts of
their receptive field respond the onset of the stimulus while some parts
respond to the offset. On the contrary, complex cells respond both the onset
and the offset. They have larger receptive fields and greater spontaneous
activity.
Binocular Sensitivity Types
According
to their binocular sensitivity, the cells in the visual cortex are classified
into four groups by Poggio and Fischer [Poggio77] as tuned excitatory (TE),
tuned inhibitory (TI), near and far. TE cells are excited by stimuli at the
fixation distance. If the stimulus is disparate more than 0.1
degrees then the cell activities are suppressed, that is, these cells are
sharply tuned to zero disparity. The response pattern of TI cells as a function
of disparity is the reverse of, but is not as sharp as, that of the TE cells.
Near cells are sensitive to stimuli near than the fixation distance and far
cells are visa versa. Among these cell groups only TE cells are ocularly
balanced. Later, other kinds of cells are also identified and it is claimed
that types according to binocular sensitivity belong to a continuum rather than
discrete groups [Freeman90].
Modelling Simple Cells
The
monocular receptive fields of simple cells are well described by Gabor
functions [Marcelja80] [Daugman80] which are filters limited in both space and frequency.
Gabor filters will be discussed in detail later in this article. There exists
evidence that simple cells are found in pairs with an approximate phase
difference of 90 degrees [Pollen81] which may compute real and imaginary parts
of a complex Gabor filter. The integration of data from monocular receptive
fields is modelled as linear summation by Ohzawa and Freeman [Ohzawa86] based
on neurophysiological experiments. Nomura et al. [Nomura90] proposed a similar
modelling where linear summation is followed by a non-linear smoothed
thresholding function. This model predicts largely the binocular behaviour of
cells in the striate cortex. Freeman and Ohzawa observed that the phase
difference sensitive responses of simple cells are not disturbed by large contrast
differences across right and left eyes. Considering this observation, they
proposed a monocular contrast gain mechanism that keeps the effect of contrast
almost constant.
Coarse-to-Fine Structure
There
is evidence that data from low-frequency channels constrain the matching at
high frequencies. Wilson et al. [Wilson91] found that channels more than 2
octaves apart process independently, but closer channels interact.
Low-frequency signals affect fusion in high-frequency channels but not vice
versa. Watt [Watt87] also concludes, after a series of experiments, that the
human visual system uses a coarse-to-fine strategy.
4. Computer Stereo Vision
The Matching Primitives
In
the beginning, we considered the problem of what to choose for matching across
images. The fact that human stereopsis can survive without monocular
recognition, is very comforting for computer stereo research, since general
recognition performance of computer vision's state-of-the-art is very weak.
We
know that raw intensity values are not appropriate as matching primitives while
recognised objects are not available. What we need, at this point, is matching
the primitives that are more abstract and invariant than intensity values that
can be determined without any help from top-down processes. We can group such
primitives that currently used in computer vision into two rough groups. The
first consists of features like edges, corners, blobs etc. which can be
detected using local intensity values. The second group, area-based properties,
are functions of intensity values that can be calculated at almost every point
of an image.
Features
Image
features which are chosen for matching are high interest points or point sets
like edgels, edge segments or intervals between edges. The features can be
localised very accurately (generally with sub-pixel resolution), so the
accuracy of computed disparity is also high. Features generally correspond to
physical boundaries of objects, surface markings or other physical
discontinuities, so provide valuable depth information. Features are typically
sparse, that is, they occupy only a very low percentage of an image. This
speeds up processing, but disparities at non-feature points should be
interpolated.
Figure 6:
Laplacian-of-Gaussian operator
Use
of features for stereo matching is biologically plausible, because cells
sensitive to edges and corners are observed in the visual system. Based on the
properties of some cells in the lateral geniculate, Marr and Hildreth [Marr80]
proposed the zero-crossings of Laplacian-of-Gaussian (LoG) filtered images for
edge detection. The LoG operator (Figure 6)
which
is Gaussian smoothing followed by a second derivative operation, has several
useful properties. The scale factor ,
which is the standard deviation of the Gausian, is inversely proportional to
the average density of edges. Besides, even large convolutions can be
calculated quickly by either approximating the LoG by a difference-of-Gaussians
function or by decomposing the LoG. The disadvantage of LoG is the displacement
of edges with growing .
After Marr [Marr82] a number of researchers used zero-crossing edges as
matching primitives. The direction of the edge is approximated as the direction
of the gradient of the filtered image. Only edgels with the same sign and with
roughly the same orientation are considered as possible matches. This is in
accordance with the psychophysical observaation that images with opposite
contrast cannot be fused.
More
abstract image features are edge segments, either linear line segments or
curves. The edgels are not matched individually but grouped into segments. This
grouping can be performed by using Gestalt rules. Grouping reduces the number
of possible matches significantly. Besides, one can define similarity measures
of two edge segments using their length, orientation, curvature, strength,
coordinates of edge points, average intensity or intensity slope at each side
etc.
Area-Based Primitives
Area
properties are those which are available at almost every point in an image. The
simplest area property is the image intensity which is not appropriate for
stereo matching due to its sensitivity to noise as well as to photometric
variation. Another simple primitive is the spatial derivative of intensity that
is less sensitive to photometric variation, but this measure is too sensitive to noise.
A
common way to match areas directly is to find correlations of areas from left
and right images. The cross-correlation and normalized cross-correlation at
position (i,j) of the right image
with disparity d are
![]()
and
respectively.
There are several other correlation-like measures of which the most frequently
used one is the sum of squared differences:
![]() .
.
Although
correlation techniques are successful at textured areas, they fail around depth
discontinuities, since the area inside the correlation window belongs to at
least two different surfaces at different depths, so the window does not match
totally at any disparity value. They also suffer from disparity gradients
because one of the signals is scaled compared to other. Besides, the accuracy
obtained is lesser when compared to feature-based matches. Another drawback of
the correlation technique is its computational complexity. As the size of the
correlation window gets larger, the computational complexity and the
uncertainty in disparity increase as well as problematic regions near
discontinuities get larger, but, match becomes more robust to noise.
Another
dense property to match is local frequency components [Clark86] [Sanger88]
[Fleet91] [Westelius92] [Weng93] [Nomura93]. The Fourier theorem states that
when a function f(x) with Fourier
transform F(u) is
shifted by an amount of x then the Fourier transform of the shifted
function ![]() is
is ![]() , so a shift in the spatial domain
corresponds to a phase shift in the frequency domain. If the left view had been
a shifted version of the right view it would have been possible to determine
the amount of shift from the phase of the Fourier transforms of both images.
But since the shift, i.e. the disparity, is different in various regions of the
images, one needs a local frequency filter to determine the phase differences.
A natural choice for such a function is the Gabor filter [Gabor46] which is a
bandpass filter with limited spatial width:
, so a shift in the spatial domain
corresponds to a phase shift in the frequency domain. If the left view had been
a shifted version of the right view it would have been possible to determine
the amount of shift from the phase of the Fourier transforms of both images.
But since the shift, i.e. the disparity, is different in various regions of the
images, one needs a local frequency filter to determine the phase differences.
A natural choice for such a function is the Gabor filter [Gabor46] which is a
bandpass filter with limited spatial width:
whose
Fourier transform is
![]()
where
the product ![]() is
1 which is the theoretical minimum of any linear complex filter [Gabor46]. This
choice is also biologically plausible since the receptive fields of simple
cells are not statistically distinguishable from Gabor filters [Marcelja80].
Besides, simple cells are found in pairs with an approximate phase difference
of 90 degrees [Pollen81] and this justifies the use of complex filters. If the
ratio of the spatial width to
the period,
is
1 which is the theoretical minimum of any linear complex filter [Gabor46]. This
choice is also biologically plausible since the receptive fields of simple
cells are not statistically distinguishable from Gabor filters [Marcelja80].
Besides, simple cells are found in pairs with an approximate phase difference
of 90 degrees [Pollen81] and this justifies the use of complex filters. If the
ratio of the spatial width to
the period, ![]() , is held constant, then the shape of the
filter and the relative bandwidth given by
, is held constant, then the shape of the
filter and the relative bandwidth given by
in
octaves remain unchanged. Figure 7 shows the real and imaginary parts of a
Gabor filter with a bandwidth of 1 octave. The 2-dimensional extension of the
filter is
 .
.
Figure 7:
The real and imaginary parts of a Gabor filter with a bandwidth of 1 octave.
Note
that the filter is separable, so computational complexity is reduced from ![]() to
to ![]() . The filtered versions of right and left images
. The filtered versions of right and left images ![]() and
and ![]() are
are
![]()
and
![]() .
.
So
that the Gabor filtered image is a band-pass signal, it can be modelled (in 1-D
for simplicity) as [Fleet91]
![]()
where
![]() is the centre
frequency equal to the frequency of the filter. The local frequency is defined
as [Papoulis65]
is the centre
frequency equal to the frequency of the filter. The local frequency is defined
as [Papoulis65] ![]() where
where ![]() . If we assume perfect sinusoids, that is,
. If we assume perfect sinusoids, that is, ![]() then we can estimate
the disparity as [Sanger88]
then we can estimate
the disparity as [Sanger88]
![]() .
.
Since
the bandwidth of the filter is non-zero, ![]() may vary around zero
and disturb the linearity. But in real images with sufficient texture the phase
is almost linear over the image except some regions. Fleet et al. [Fleet91]
showed that the bandpass phase is not sensitive to typical distortions that
exist between right and left images.
may vary around zero
and disturb the linearity. But in real images with sufficient texture the phase
is almost linear over the image except some regions. Fleet et al. [Fleet91]
showed that the bandpass phase is not sensitive to typical distortions that
exist between right and left images.
Note
that the phase measurements give the disparity directly, so a search is not
performed for the best fit, because of this phase-based techniques are
sometimes called ``correspondenceless''. It is worth mentioning that matching
phases is a general case of matching zero-crossings because the zero-crossings
of band-pass filters such as LoG correspond roughly to level curves at ![]() of the phase signal.
Another advantage of the phase-measurements is that they provide sub-pixel
measurements without explicitly reconstructing the signal between pixels. This
hyperacuity is also in accordance with biological findings.
of the phase signal.
Another advantage of the phase-measurements is that they provide sub-pixel
measurements without explicitly reconstructing the signal between pixels. This
hyperacuity is also in accordance with biological findings.
Phase
measurements are valid within a limited range of disparity because of the
wrap-around problem: we measure only the principal component of the phase in
the range ![]() , so a filter of fundamental frequency
, so a filter of fundamental frequency ![]() signals only
disparities of
signals only
disparities of ![]() to
to ![]() .
.
Nomura
[Nomura93] introduced a fundamental equation for binocular disparity,
![]()
where
o is the eye position, I is the intensity and d is the disparity. This equation is a
variation of the gradient model of optical flow field. Substituting Gabor
filtered image in place of I, he
obtained
![]()
Besides
he showed that the terms other than d
can be approximated as linear combinations of far, near and tuned inhibitory
type simple cells.
Another
area-based method that takes its flavour from natural stereo vision is the
cepstral filtering approach of Yeshurun and Schwartz [Yeshurun89]. Cepstral
filtering is a Fourier transformation followed by a logarithm and an inverse
Fourier transform. Yeshurun and Schwartz append left image, l(x,y) to the left of right image, r(x,y). Assuming that the width of the
patches is D and r(x,y) is equal to l(x-d,y) where d is the
disparity to be computed, the compound image f(x,y) can be written as
![]()
with
the Fourier transform
![]() .
.
When
we take the logarithm of F(u,v), the
product becomes a sum:
![]()
Taking
the Inverse Fourier Transform, we obtain
 .
.
Thus,
we can find the disparity of the patch by locating the largest delta function.
Ocular dominance columns in the visual cortex that correspond to alternating image
patches from right and left retinae have great similarity with the above
method. Besides, the width of ocular dominance columns is in accordance with
the Panum's fusional area. The authors also claim that this cepstral filter can
be implemented using a set of bandpass filters similar to those found in the
visual cortex, so this approach is biologically plausible.
Constraints
Since
the combinations of all possible matches reach an enormous number, some a
priori data is needed about the disparity field. The assumptions made are
imposed on the algorithms as constraints. Every stereo algorithm uses some of
these constraints implicitly or explicitly.
Smoothness
Marr
and Poggio [Marr76] stated that matter is cohesive, that is,
"it is separated into objects, and the
surfaces of objects are generally smooth in the sense that the surface
variation due to roughness cracks , or other sharp differences that can be
attributed to changes in distance from the viewer, are small compared with the
overall distance from the viewer"[Marr82].
The
disparity field produced by such surfaces is smooth everywhere except at object
boundaries, which occupy only a small portion of an image. Considering this
fact, the computed disparity field is forced to be as smooth as possible. Under
the smoothness assumption, ill-posed stereo problem has a unique solution. This
constraint is related to regularization theory that is a branch of mathematics
dealing with ill-posed problems [Poggio85]. Blind use of the smoothness
constraint can cause problems at depth discontinuities. A method proposed to
avoid smoothing of the disparity field at and near these areas is using line
processes where the smoothness constraint is broken.
A
weaker form of the smoothness constraint is the figural continuity constraint
that was first exploited by Mayhew and Frisby [Mayhew81]. This constraint
implies smooth variation of disparity along edges, because the edgels on the
same edge segment are assumed to belong to the same object and this assumption
is almost always valid. Note that the figural continuity constraint is
automatically satisfied when contours are used as matching primitives, so the
above correction cannot be applied.
Smoothness
constraint can also be expressed as a gradient limit on disparity that is known
to be used in human stereopsis. Generally, the support from a neighbouring
match to a potential match is inversely scaled by the disparity gradient
between the two matches [Prazdny85].
Opaqueness
This
assumption is violated if there are semi-transparent surfaces in the image, but
this is very rare in natural images except objects like fence or bush that
occludes background partially. In case of transparency, continuity constraint
is not applicable, since the disparity field switches frequently between
background and foreground. Human visual system can cope with transparencies
without difficulty. To handle transparency as well as discontinuities at object
boundaries, Prazny introduced the coherence principle that states that the
world is made of (either opaque or transparent) objects each occupying a well
defined 3D volume. So:
"a discontinuous disparity may be a
superposition of a number of several interlaced continuous disparity fields
each corresponding to a piecewise smooth surface" as a result "Two disparities are either similar, in which
case they facilitate each other because they possibly contain information about
the same surface, or dissimilar in which case they are informationally
orthogonal, and should not interact at all because they potentially carry
information about different surfaces" [Prazdny85].
He
proposed the support function
where
![]() is the support from
the neighbouring point
is the support from
the neighbouring point ![]() to point
to point ![]() . Among possible matches at point
. Among possible matches at point ![]() only the one with
minimum disparity difference
only the one with
minimum disparity difference ![]() is used in
calculation of support. The term
is used in
calculation of support. The term ![]() on the exponent is the
disparity gradient so the support function imposes a disparity gradient limit
implicitly.
on the exponent is the
disparity gradient so the support function imposes a disparity gradient limit
implicitly.
Orderedness
Assume
a point A, and a point B that is right to A match points A' and B' in the other image. Then, this
constraint states that B' cannot be
at the left side of A'. Resulting
disparity constraint violates this assumption if the disparity difference
between a figure and its background is larger than the width of the figure in
the image. Such objects, like columns, ropes etc. are rare in natural images,
so this constraint is frequently used to reduce ambiguity. Human visual system
also prefers order-preserving solutions [Weinshall89].
Uniqueness
This
constraint states that a point in one image matches only one point in the other
image, that is, the disparity field is a single valued function. In stereo
pairs involving only opaque surfaces, this constraint greatly reduces the
number of possible solutions. If human visual system uses this constraint or
not is a controversial problem since there is evidence for both use of this
constraint [Weinshall89] and for existence of multiple matches [Pollard90].
Compatibility
If
point A in the right image matches point B in the left, the point B matches
point A. Some researchers calculate right and left image disparities
independently and then check for compatibility across the field to eliminate
false matches. Figure 8 shows valid and invalid matches across two lines
schematically where circles and arrows represent pixels and matches,
respectively.
Epipolarity
Affine
transformations are applied to the images such that the epipolar lines are
collinear with image rows. The determination of the epipolar line reduces the
search space to one-dimension, while the alignment with image rows greatly
simplifies the search. In human visual system, this constraint is satisfied
once both eyes are fixated on the same point, but still small vertical
disparities remain due to the perspective projection onto the retinae.
Figure 8:
Matches between rows R and L violating a) the uniqueness constraint,
b)
the compatibility constraint and c) the orderedness constraint.
d)
A valid matching field with 2 occluded pixels in row R.
Limited Disparity Range
In
accordance with Panum's fusional area, the disparity range in which a match is
searched for is determined a priori. Sometimes, even when the epipolarity
constraint is used, a small vertical disparity range is allowed to compansate
for inexact registration.
Strategies
Once
matching primitives are decided and constraints are set, we face a very large
problem. A multi-dimensional space is to be searched for (in some sense) the
best solution which satisfies all constraints. Since to visit all states for
the best solution is impractical, if not impossible, we need to employ
heuristics to reach the best or at least a good solution.
Multi-channel analysis
The
existence of different band-pass frequency channels in the vertebrate visual
cortex led some researchers to use frequency filters in stereo algorithms.
Gaussian smoothing and Gabor-like filters are mostly used in band-pass
filtering. As the channel gets coarser (low-frequency), the size of the
required masks gets larger, so the computational cost of the filters increases.
An equivalent and simpler method is to smooth the image using a Gaussian kernel
and to subsample it successively. This way, a Gaussian image pyramid with
various resolutions is formed. Usually a spacing of one octave between the
channels is used which leads to resolutions of half of the finer channel (i.
e., 256x256, 128x128, 64x64). A more rapid way to form the image pyramid is
image consolidation which replaces four adjacent pixels with one pixel having
the intensity of average of the four pixels. Consider an n by n stereo pair with
disparity range m. If integer
disparity values are used there are ![]() possible solutions to
the problem, while the number of possible solutions in the coarser channel is
possible solutions to
the problem, while the number of possible solutions in the coarser channel is ![]() . The accuracy of the result is half of the coarser channel.
But we can use this result to constrain the solution in the next finer
. The accuracy of the result is half of the coarser channel.
But we can use this result to constrain the solution in the next finer
Figure 9:
Coarse-to-fine control strategy.
channel.
This strategy is called coarse-to-fine analysis (See Figure 9) and is very
popular in stereo research. Besides the computational savings, this method
generally leads more accurate final results.
The
disadvantage of the method is the spreading of any error in a coarse level to
finer levels. Also this methods assume spectral continuity. This approach is
explained in the next subsection. The alternative multi-channel approach to
coarse-to-fine analysis is to process each channel independently and to combine
subsequently.
Integrating with Other Vision Modules
It
is well known that human visual perception owns its power to integration of
information from a variety of sources such as motion, shading etc. Computer
vision maturing in each of such methods now is in the way of building more
complete vision systems integrating those modules.
Fusing
motion and stereo was considered by a number of researchers [Mutch86]
[Waxman86] [Li93]. If we know the disparity field or optical flow for a
sequence of stereo images, it is easier to compute the other one. Besides, the
discontinuities of optical flow are generally also depth discontinuities. So
one of them is computed first and is used to guide the other. But Toborg and
Hwang [Toborg91] calculated stereo disparity, optical flow and intensity
contours simultaneously and co-operatively. They demonstrated the effectiveness
of integrating visual modules on synthetic images.
Other
visual cues used with stereopsis include shape-from-shading [Thompson93]
[Grimson84] [Bulthoff88] and shape-from-texture [Moerdler88]. Also, active
systems which seek for useful additional information by controlling camera
parameters are used more and more frequently [Ahuja93] [Coombs92] [Krotkov93]
[Yuille90].
5. Conclusions
Natural
evolution seem to find the optimum solution for perception of the environment.
But the solution is optimum in terms of the needs of the species and the
available "hardware" of biological systems, so the way they solve
perceptual problems may not be appropriate for machine vision. Nevertheless the
information obtained through the study of these systems proved to be useful and
guiding for design of computer vision systems. This result may also be
generalized to other kinds of information processing systems. As the biological
basis of perception and cognition is understood better, more powerful
information processors can be built.
References
[Ahuja93] Narendra
Ahuja and A. Lynn Abbott, "Active Stereo: Integrating Disparity, Vergence,
Focus, Aperture, and Calibration for Surface Estimation", IEEE Transactions
on Pattern Analysis and Machine Intelligence, vol. 15, no. 10, 1007-1029,
October 1993.
[Badcock85] David R.
Badcock and Clifton M. Schor, "Depth-Increment Detection Function for
Individual Spatial Channels", Optical Society of America A, vol. 2, no. 7,
1211-1216, July 1985.
[Bruce90] Vicki Bruce
and Patrick Green, Visual Perception: Physiology, Psychology and Ecology,
Lawrence Erlbaum Associates, Hove, UK, 1990.
[Bulthoff88] Heinrich
H. Bulthoff and Hanspeter A. Mallot, "Integration of Depth Modules: Stereo
and Shading", Optical Society of America A, vol. 5, no. 10, 1749-1758,
1988.
[Burt80] Peter Burt
and Bela Julesz, "A Disparity Gradient Limit for Binocular Vision",
Science, vol. 208, 615-617, May 1980.
[Clark86] J. J. Clark
and P. D. Lawrence, "A Theoretical basis for Diffrequency Stereo",
Computer Vision, Graphics and Image Processing, vol. 35, 1-19, 1990.
[Cochran90], Steven
Douglas Cochran, Surface Description from Binocular Stereo, PhD. Thesis, School
of Engineering, University of Southern California, November 1990.
[Coombs92] David John
Coombs, Real-time Gaze Holding in Binocular Robot Vision, PhD. Thesis,
Department of Computer Science, University of Rochester, June 1992.
[Daugman80] J. G.
Daugman, "Two-Dimensional Spectral Analysis of Cortical Receptive Field
Profile", Vision Research, vol. 20, 847-856, 1980.
[Field87] David J.
Field, "Relations Between the Statistics of Natural Images and the
Response Properties of Cortical Cells", Optical Society of America A, vol.
4, no. 12, 2379-2394, December 1987.
[Fleet91] David J.
Fleet, Allan D. Jepson, Michael R. M. Jenkin, "Phase-Based Disparity
Measurement", CVGIP: Image Understanding, vol. 53, no. 2, 198-210, March
1991.
[Freeman90], Ralph D.
Freeman and Izumi Ohzawa, "On the Neurophysiological Organization of
Binocular Vision", Vision Research, vol. 30, no. 11, 1661-1676, 1990.
[Gabor46] D. Gabor,
"Theory of Communication", Journal of IEE, vol. 93, 429-459, 1946.
[Grimson84] W. E. L.
Grimson, "Binocular Shading and Visual Surface Reconstruction",
Computer Vision, Graphics and Image Processing, vol. 28, 19-43, 1984.
[Hubel62], David H.
Hubel and T. N. Weisel, "Receptive Fields, Binocular Interaction and
Functional Architecture in the Cat's Visual Cortex", Journal of
Physiology, London, vol. 160, 106-154, 1962.
[Hubel88], David H.
Hubel, Eye, Brain and Vision, Scientific American Library, New York, USA, 1988.
[Julesz60] Bela
Julesz, "Binocular Depth Perception of Computer Generated Patterns",
Bell Systems Technical Journal, vol. 39, 1125-1162, 1960.
[Julesz71] Bela
Julesz, Foundations of Cyclopean Perception, The University of Chicago Press,
Chicago, 1971.
[Krotkov93] Eric
Krotkov and Ruzena Bajcsy, "Active Vision for Reliable Ranging:
Cooperating Focus, Stereo, and Vergence", International Journal of
Computer Vision, vol. 11, no. 2, 187-203, 1993.
[Li93] Lingxiao Li and
James H. Duncan, "3-D Translational Motion and Structure from Binocular
Image Flows", IEEE Transactions on Pattern Analysis and Machine
Intelligence, vol. 15, no. 7, 657-667, 1993.
[Marcelja80] S.
Marcelja, "Mathematical Description of the Responses of Simple Cortical
Cells", Optical Society of America A, vol. 70, 1297-1300, 1980.
[Marr76] David Marr
and T. Poggio, "A Cooperative Computation of Stereo Disparity",
Science, vol. 194, 283-287, 1976.
[Marr80] David Marr
and E. Hildreth, "Theory of Edge Detection", Proceedings of Royal
Society of London B, vol. 207, 187-217, 1980.
[Marr82] David Marr,
Vision, W. H. Freeman and Company, New York, 1982.
[Mayhew81] John E. W. Mayhew
and John P. Frisby, "Psychophysical and Computational Studies towards a
Theory of Human Stereopsis", Artificial Intelligence, vol. 17, 349-385,
1981.
[Moerdler88] M. L.
Moerdler, "The Integration from Stereo and Multiple Shape-from-Texture
Cues", Image Understanding Workshop, 786-793, April 1988.
[Morgan82] M. J.
Morgan and R. J. Watt, "Mechanisms of Interpolation in Human Spatial
Vision", Nature, vol. 299, 553-555, October 1982.
[Nomura90] M. Nomura
and G. Matsumoto and S. Fujiwara, "A Binocular Model for the Simple
Cell", Biological Cybernetics, vol. 63, 237-242, 1990.
[Nomura93] Masahide
Nomura, "A Model for Neural Representation of Binocular Disparity in
Striate Cortex: Distributed Representation and Veto Mechanisms",
Biological Cybernetics, vol. 69, 165-171, 1993.
[Mutch86] K. M. Mutch,
"Determining Object Translation Information Using Stereoscopic
Motion", IEEE Transactions on Pattern Analysis and Machine Intelligence,
vol. 8, no. 6, 750-763, 1986.
[Ohzawa86] Izumi
Ohzawa and Ralph D. Freeman, "The Binocular Organization of Simple Cells
in the Cat's Visual Cortex", Journal of Neurophysiology, vol. 56, no. 1,
221-242, July 1986.
[Papoulis65] A.
Papoulis, Probability, Random Variables and Stochastic Process, McGraw-Hill,
Singapore, 1965.
[Poggio77] G. F.
Poggio and B. Fischer, "Binocular Interaction and Depth Sensitivity in
Striate and Prestriate Cortex of Behaving Rhesus Monkey", Journal of
[Pollen81] Daniel A. Pollen and Steven F. Ronner, "Phase Relationships
Between Adjecent Simple Cells in the Visual Cortex", Science, vol. 212,
1409-1411, June 1981. Neurophysiology, vol. 40, no. 6, 1392-1405, November
1977.
[Poggio85] T. Poggio,
V. Torre and C. Koch, "Computational Vision and Regularization
Theory", Nature, vol. 317, no. 26, 314-319, September 1985.
[Pollard90], Stephen
B. Pollard and John P. Frisby, "Transparency and the Uniqueness Constraint
in Human and Computer Stereo Vision", Nature, vol. 347, no. 11, 553-556,
October 1990.
[Pollen81] Daniel A.
Pollen and Steven F. Ronner, "Phase Relationships Between Adjecent Simple
Cells in the Visual Cortex", Science, vol. 212, 1409-1411, 19 June 1981.
[Prazdny85] K.
Prazdny, "Detection of Binocular Disparities", Biological
Cybernetics, vol. 23, no. 5, 93-99, 1985.
[Sanger88] T. D.
Sanger, "Stereo Disparity Computation Using Gabor Filters",
Biological Cybernetics, vol. 59, 405-418, 1988.
[Schiller76a] Peter
Schiller and Barbara L. Finlay and Susan F. Volman, "Quantitative Studies
of Single-Cell Properties in Monkey Striate Cortex. I. Spatiotemporal
Organization of Receptive Fields", Journal of Neurophysiology, vol. 39,
no. 6, 1288-1319, November 1976.
[Schor84] C. Schor, I.
Wood and J. Ogawa, "Binocular Sensory Vision is Limited by Spatial
Resolution", Vision Research, vol. 24, 661-665, 1984.
[Splillmann90] L.
Splillmann and J. S. Werner, editors, Visual Perception: the Neurophysiological
Foundations, Academic Press, Inc., New York, USA, 1990.
[Thompson93] Clay Matthew Thompson, Robust Photo-Topography by Fusing Shape-from-Shading and Stereo, PhD. Thesis, Massachusets Institute of Technology, February 1993.
[Toborg91] Scott T.
Toborg and Kai Hwang, "Cooperative Vision Integration Through
Data-Parallel Neural Computations", IEEE Transactions on Computers, vol.
40, no. 12, 1368-1379, 1991.
[Watt87] R. J. Watt,
"Scanning from Coarse to Fine Spatial Scales in the Human Visual System
After the Onset of a Stimulus", Optical Society of America A, vol. 4, no.
10, 2006-2021", October 1987.
[Waxman86] A. M.
Waxman and J. H. Duncan, "Binocular Image Flows: Steps Toward Stereo-Motion
Fusion", IEEE Transactions on Pattern Analysis and Machine Intelligence,
vol. 8, no. 6, 715-731, 1986.
[Weinshall89] Daphna
Weinshall, "Perception of Multiple Transparent Planes in Stereo
Vision", Nature, vol. 341, no. 26, 737-739, October 1989.
[Weng93] J. J. Weng,
"Image Matching Using the Windowed Fourier Phase", International
Journal of Computer Vision, vol. 11, 211-239, 1993.
[Westelius92] C.-J.
Westelius, Preattentive Gaze Control for Robot Vision, PhD Thesis, Department
of Electrical Engineering, Linköping University, 1992.
[Wilson91] Hugh R.
Wilson and Randolph Blake and D. Lynn Halpern, "Coarse Spatial Scales
Constrain the Range of Binocular Vision on Fine Scales", Optical Society
of America A, vol. 8, no. 1, 229-236, January 1991.
[Yeshurun89] Yehezkel
Yeshurun and Eric L. Schwartz, "Cepstral Filtering on a Columnar Image
Artchitecture: A Fast Algorithm for Binocular Stereo Segmentation", IEEE
Transactions on Pattern Analysis and Machine Intelligence, vol. 11, no. 7,
759-767, July 1989.
[Yuille90] Alan Yuille
and Davi Geiger, "Stereo and Controlled Movement", International
Journal of Computer Vision, vol. 4, 141-152, 1990.