|
EasyNumerics Software |
|
Function Plotting
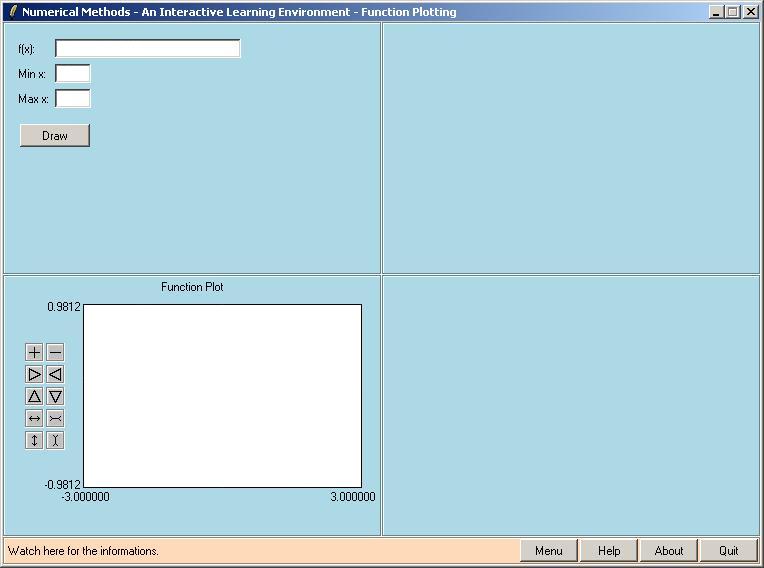
When you select the "Function Plotting" module from the main menu, the following window will appear.
- sin, cos, tan, asin, acos, atan, sinh,
cosh, tanh Some valid examples for f(x) are
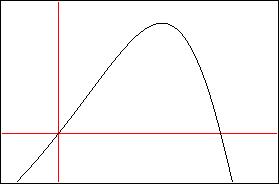
- x*x*x - 2*x*x + 4*x - 20 All the spaces in f(x) are ignored. All the functions work in double precision. Except pow, they all take one argument. pow(b,n) requires two arguments, the base and the exponent. If the base is a negative number the exponent must be an integer. Pressing the Draw button will draw the function in the lower left window. As seen below the function is plotted as a black line. x=0 and y=0 lines passing from the origin are shown in red. Maximum and minimum values of x and y are shown at the edges of the plot frame.
There are ten small buttons on the left of the plot frame. These can be used to
You can also use the left mouse button to freely move the function plot in any direction you want. Press the left mouse button and drag. Right mouse button can be used to draw a zoom box. Press the right mouse buton and drag. You will see a blue zoom box, as shown below. When you release the mouse button the plot will be zoomed in to show the region in the zoom box.
Please visit the movies section to watch sample runs of EasyNumerics. |


 --- manual zoom in --->
